

PDF reports are handy for a lot of use cases. They only contain the insights and data you want to share, can act as a backup and are easily shared with anyone who needs them.
💡 Looking for a digital way to share your data? Check out this article to learn more about share links and other export options.
Exporting a PDF report can be done using the Export Report button under the Export menu in 2D mode of an operation.
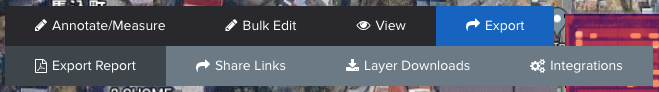
This opens the PDF report modal, containing two types of report for you to choose from.
Standard report
The standard report is meant to share the details of an operation and its results. It's supported for all data products and includes the following sections:
A front page
A table of contents
Information regarding the site that has been inspected
Information regarding the inspection that has been performed
Overviews of any delivered map layers (visual orthomosaic, thermal orthomosaic, DSM)
Statistics regarding the inspection
Detailed information regarding annotations, anomalies or detected elements
The statistics and detail pages can be included or excluded by ticking the corresponding checkbox.
💡 If any filters are active while exporting the PDF report, they can be applied by ticking the Apply filters checkbox. Learn more about filters
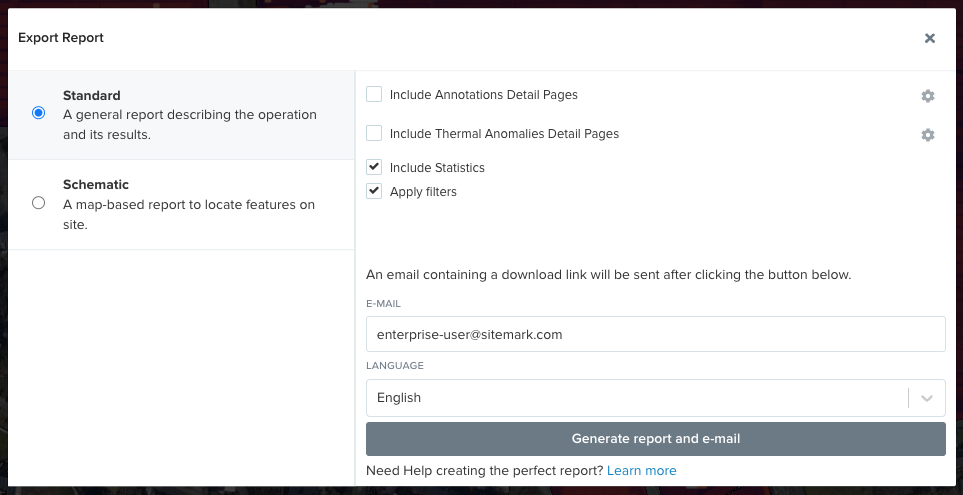
The feature detail pages contain a cutout of any visual, thermal or DSM layer of the operation, as well as any information contained in that feature. The cog icons can be used to configure exactly which information has to be included in the report.
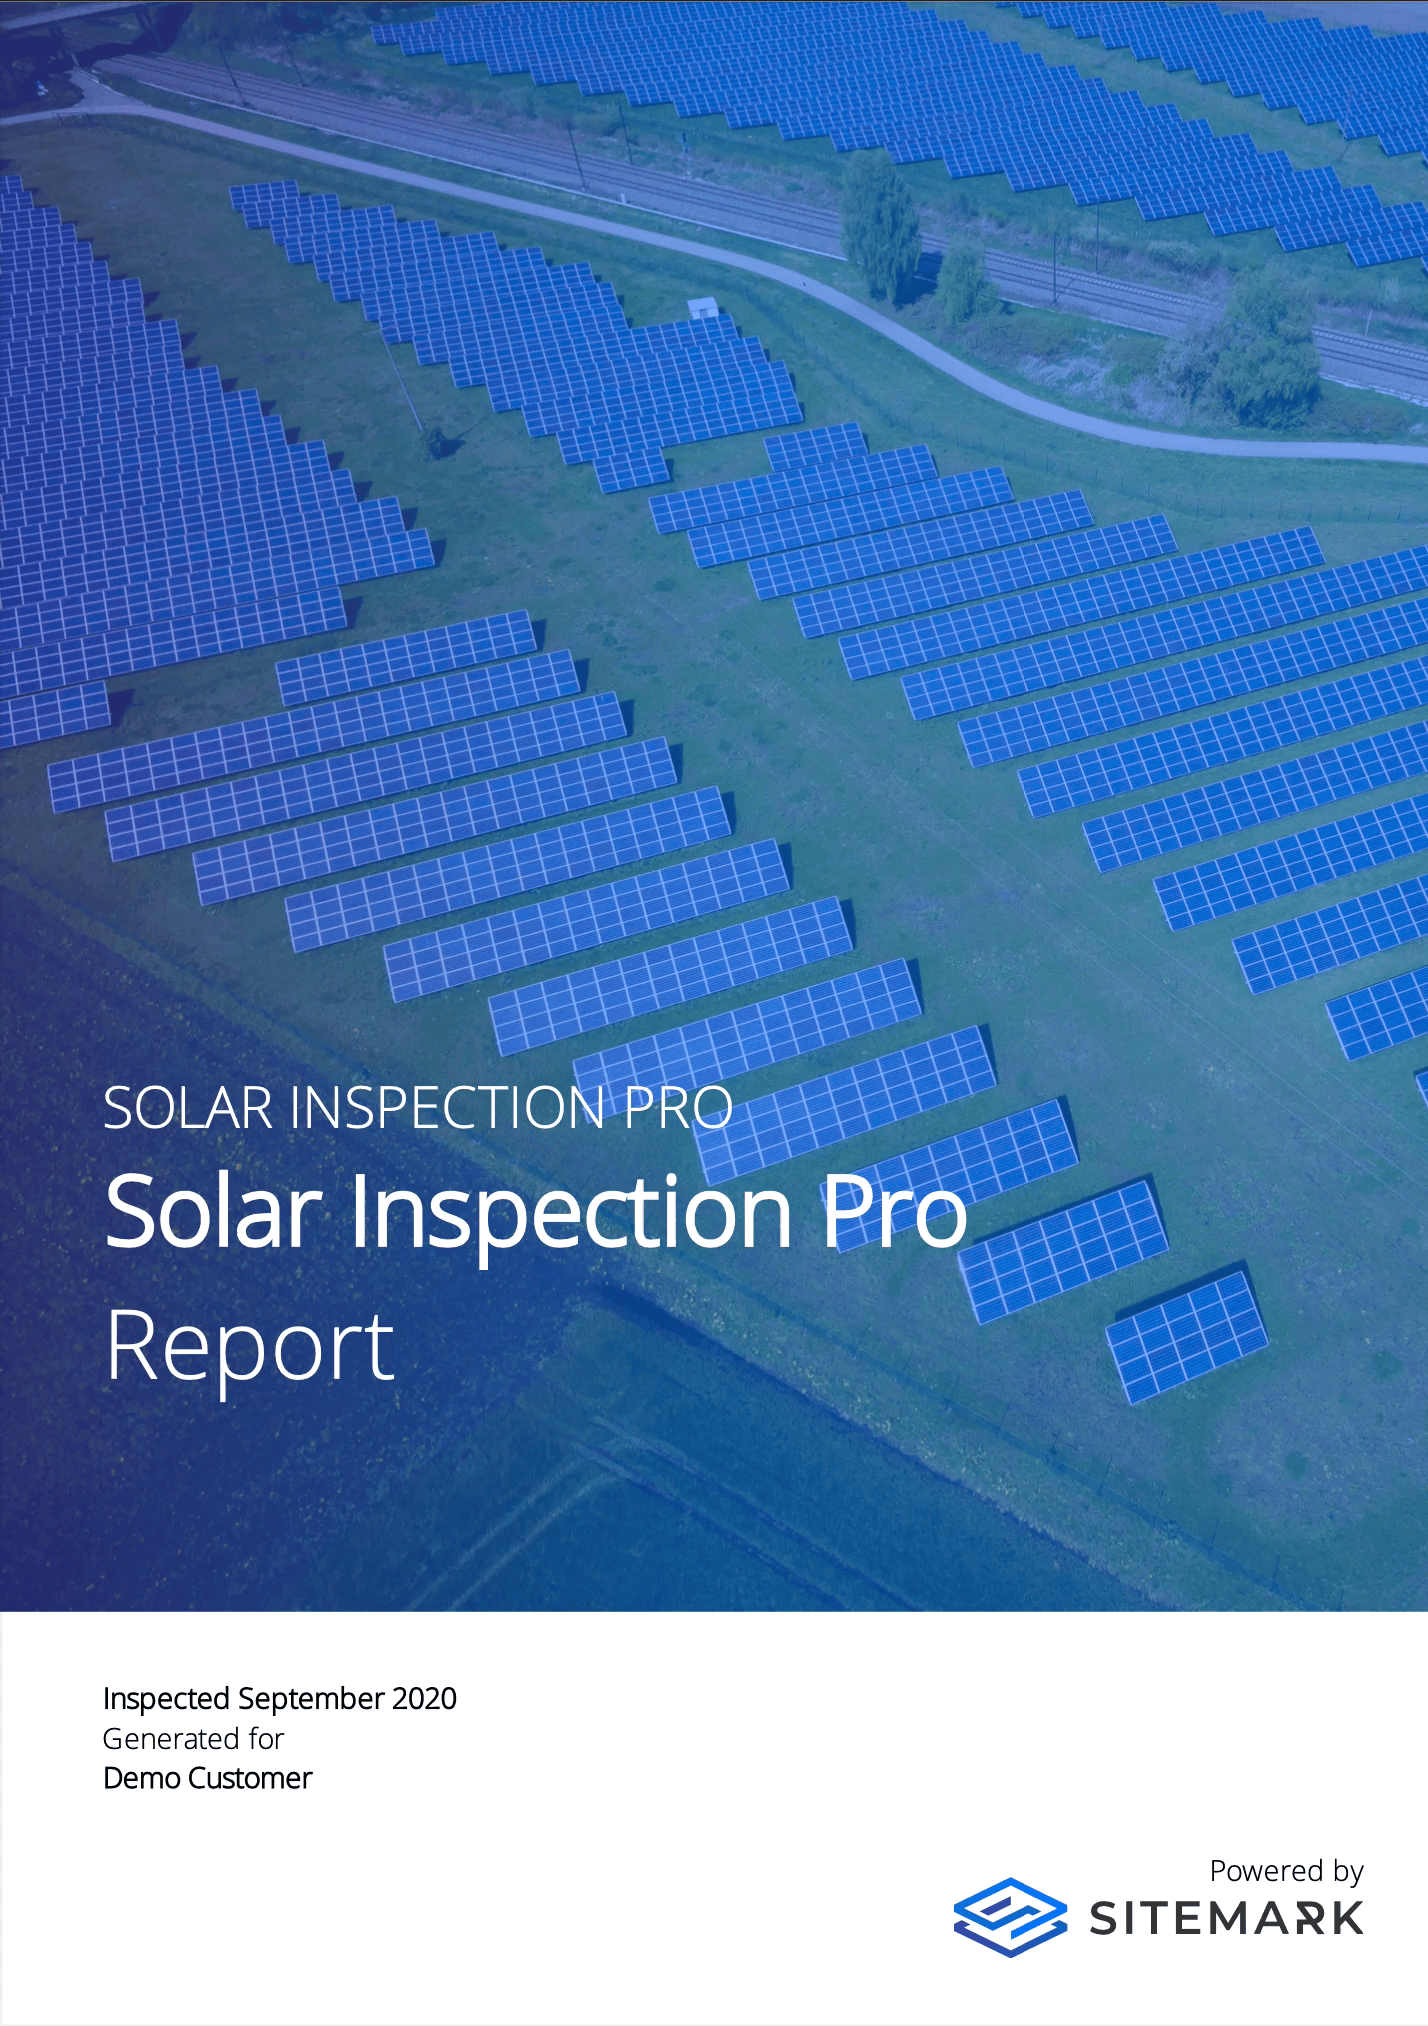
Here's an example of a standard report of a solar inspection operation:
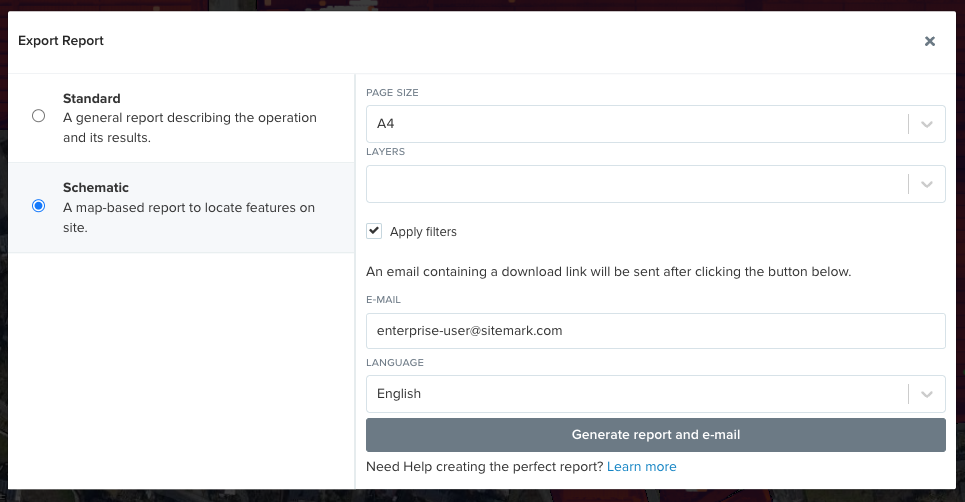
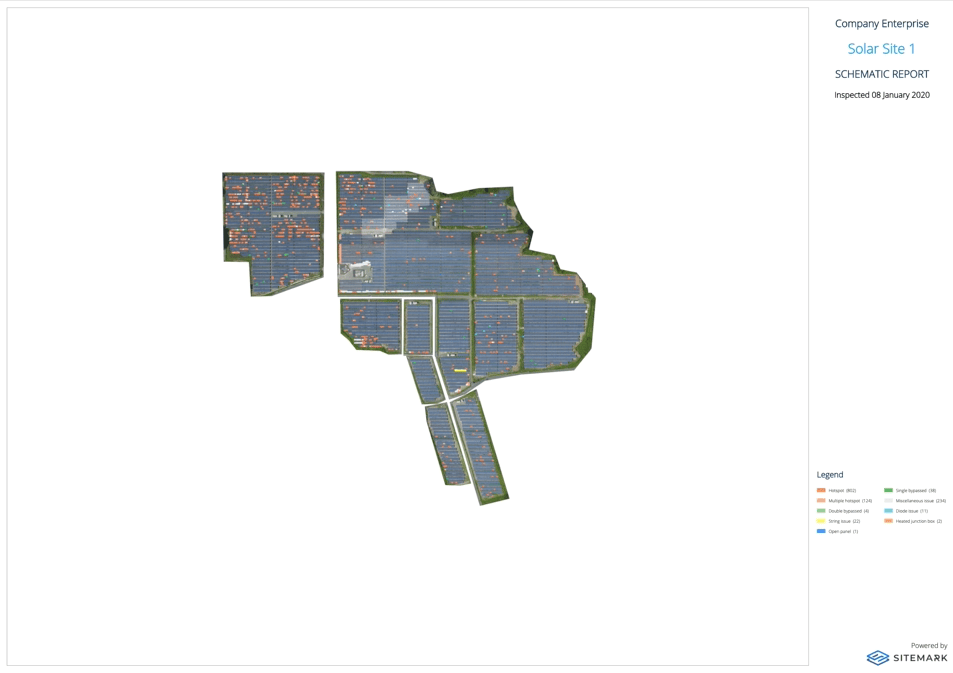
Schematic report
⚠️ The schematic report is only available for Solar Inspection products.
The schematic report is a map-based report used to locate features on site. It can be printed in a variety of sizes, ranging from A0 to A4. Any visual orthomosaïc layer or optimised PDF overlay can be used as a base layer.
The first page always contains an overview of the entire site. Since that overview is not accurate enough for larger sites, additional zoomed-in pages with a fixed resolution are added. The zoomed pages cover the entire site in a grid-like pattern. Pages without any anomalies are skipped, as they wouldn't add any value.
💡 If any filters are active while exporting the PDF report, they can be applied by ticking the Apply filters checkbox. Learn more about filters
Here's an example of a schematic report based on the visual orthomosaïc of the site.
The schematic report is perfect for fixing / checking problematic modules in the field. It works great in combination with the remedial action and status fields of the platform.
Learn more about managing remedial actions on the platform
Learn more
Want to learn more about creating the perfect reports?
These support articles might be interesting: