

The data on the SIDEREAL Fuse platform is a goldmine containing a bunch of very useful insights. Using filters can help you dig deeper and better understand your data.
1️⃣ How does it work?
Filters are available on every data product and thus for every industry (solar, construction, mining, etc.). You can use them both on the insights delivered by SIDEREAL. For example, you can look for the total number and the spread of the solar anomalies. Further down this article we'll give some other examples applicable in the different industries.
On SIDEREAL Fuse, you will find the Filters feature at the top right of the detail page of a completed operation, as we show in the following print screens:
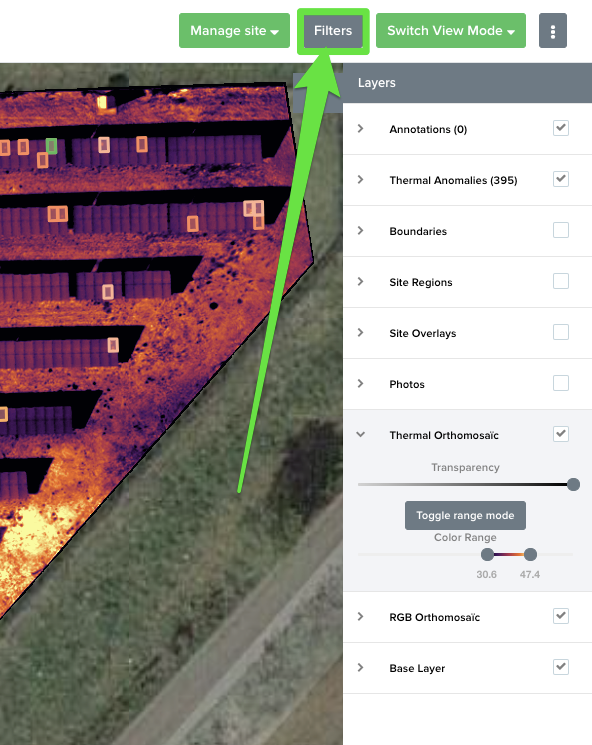
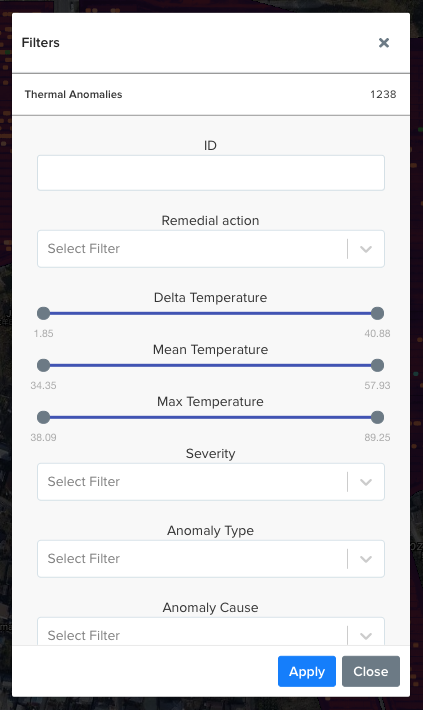
Clicking the button opens the Filters pop-up window:
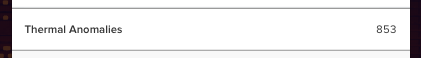
Set whatever filters you like. You'll see that the number next to the layer header changes to the number of items that matches your filter settings.
Pressing the Apply button will apply the filters and close the pop-up window. You'll see that the SIDEREAL Fuse platform updates the map content, only showing the filtered items.
2️⃣ What filters can I use?
Every Layer has its own properties and thus also its own filters.
For solar anomalies for example you'll see filters for type, cause, severity, delta temperatures, etc.
For annotations you'll see filter options for the different measurements: length, area, volume, etc. In the example below we show that there are different Filter options for different layers, i.e. the Annotations layer and the Thermal Anomalies layer.
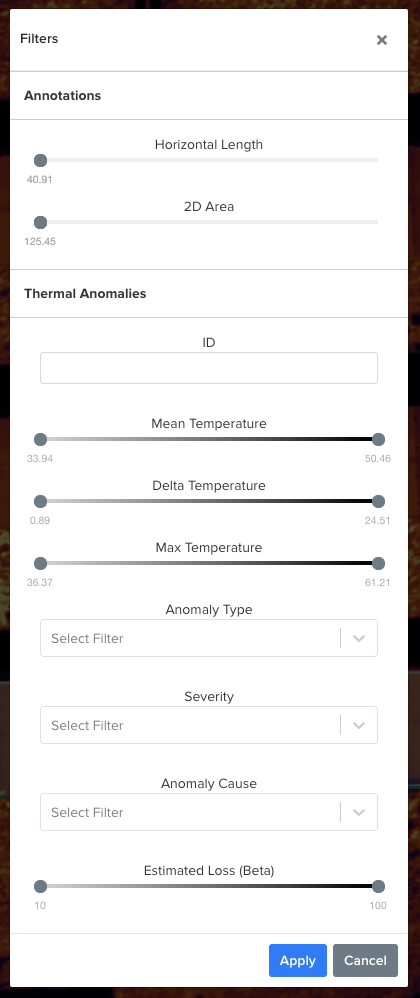
💡 Note that you'll only see a certain filter if the data on your operation contains that property. If you didn't make any measurements for example, you won't see any filters for annotations.
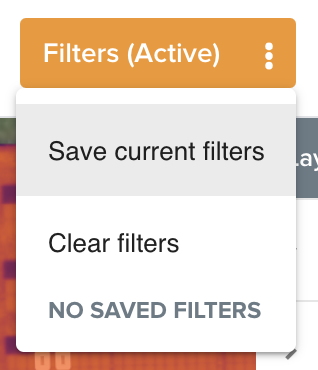
3️⃣ Saving Filters
When handling large amounts of data the filters become very useful to narrow down what you're looking at and focus your analysis on certain aspects of the data. However spending time getting the right filter and then needing to switch to a different view that requires another filter will mean you're spending your time making sure the filters are correct and not what you want to be doing, your analysis.
Using the save filter feature could save you a large amount of time. Instead of having to re-do the filter each time, you can save your current view and then revisit that data view whenever you like. This is also visible to the other users on the platform, meaning that you can share your views with your teammates so they can see what you can.
4️⃣ What can I use it for?
You can use the filters for a lot of different things:
Focus on a subset of anomalies or annotations on the map. It makes it easier to find specific problems and analyse them in more detail.
Export a PDF report containing a subset of anomalies or annotations. Make a report containing only severe anomalies for example, or report on the stockpiles that are running low.
Export a CSV containing a subset of anomalies or annotations.
Want to learn more about exporting and sharing data? Check out this article.Push a list of anomalies to the SIDEREAL Field App to let your technicians know what to solve. Want to learn more about the SIDEREAL Field App and how we successfully integrated with the Fulcrum mobile solution? Check out this article.
Zoom in on your data in statistics mode. See what's causing all those hotspots, or find out how much you're losing because of vegetation.
Want to learn more about statistics mode? Check out this article.Grant someone restricted access to your data using a filtered share link. Just save the filters you want and use the filter button next to the share link to apply them.
Want to learn more about share links? Check out this article.