

Getting started
Let's start with a quick look at the Statistics Mode on the SIDEREAL Fuse platform.
Before we dive into the details from the statistics mode, we need to make sure you have defined some regions on your site. Regions will help you to get better insights on your site inspection results. To set up regions on your site, open a completed operation, click Manage site and choose Regions in the top right corner of your screen.
Okay, as soon as you have set up the regions on your site, you can go back to the completed operation and switch view mode to Statistics Mode.
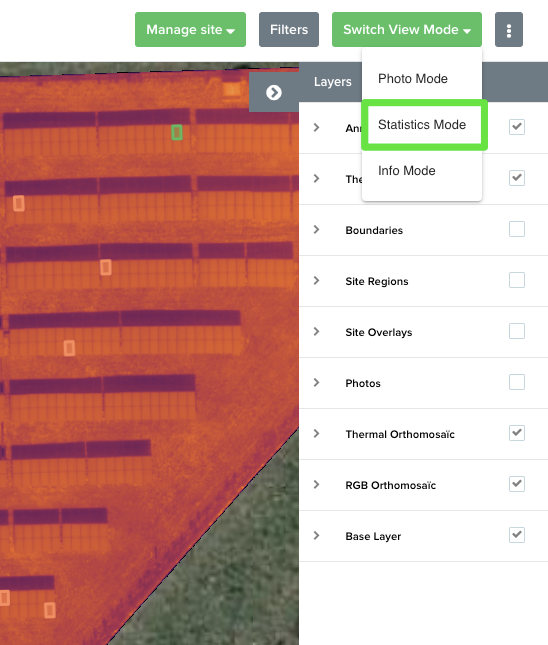
Statistics Mode
In Statistics Mode the SIDEREAL Fuse platform shows different charts at the left side and some detailed view on the right side of the page. Each time when you click on a certain chart, you will get the detailed view of that chart at the right side. When hovering your mouse cursor of the chart elements, the platform will also pop-up the exact figures.
💡 When you have defined some regions on your site, you will get a detailed view per region. This might give you very useful information about your site and how your site is performing.
Now, we will explain each and every chart that the platform is showing.
Loss estimation
To get a good estimate of your power loss, you need to know the following site properties:
Feed in tariff
Photovoltaic power potential (PVOUT)
Panel Maximum Power (Pmax)
More info needed about the site properties, please check this article.
As soon as you have completed the site properties, the loss estimation in the Statistics Mode will show you good estimates for your site, like for example:
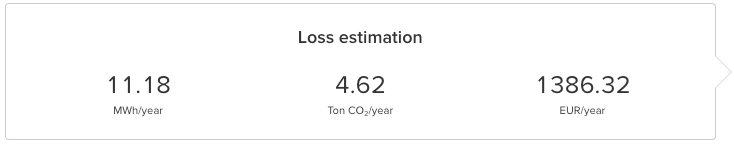
The total loss estimation is the sum of all loss estimations from the separate solar panels which do have a thermal anomaly. The loss estimation for a separate panel is calculated in the following way:
(% Panel loss * Panel Maximum Power) * Photovoltaic power potentialThe platform is using the photovoltaic power potential (PVOUT) to calculate the MWh/year loss. Together with some other statistical data*, the MWh/year is converted into CO2 loss and financial loss, which is shown in the loss estimation.
*The CO2 is calculated using an worldwide average coming from the Organisation for Economic Co-operation and Development.
If you are curious to know what it is the status in your country, have a look here.
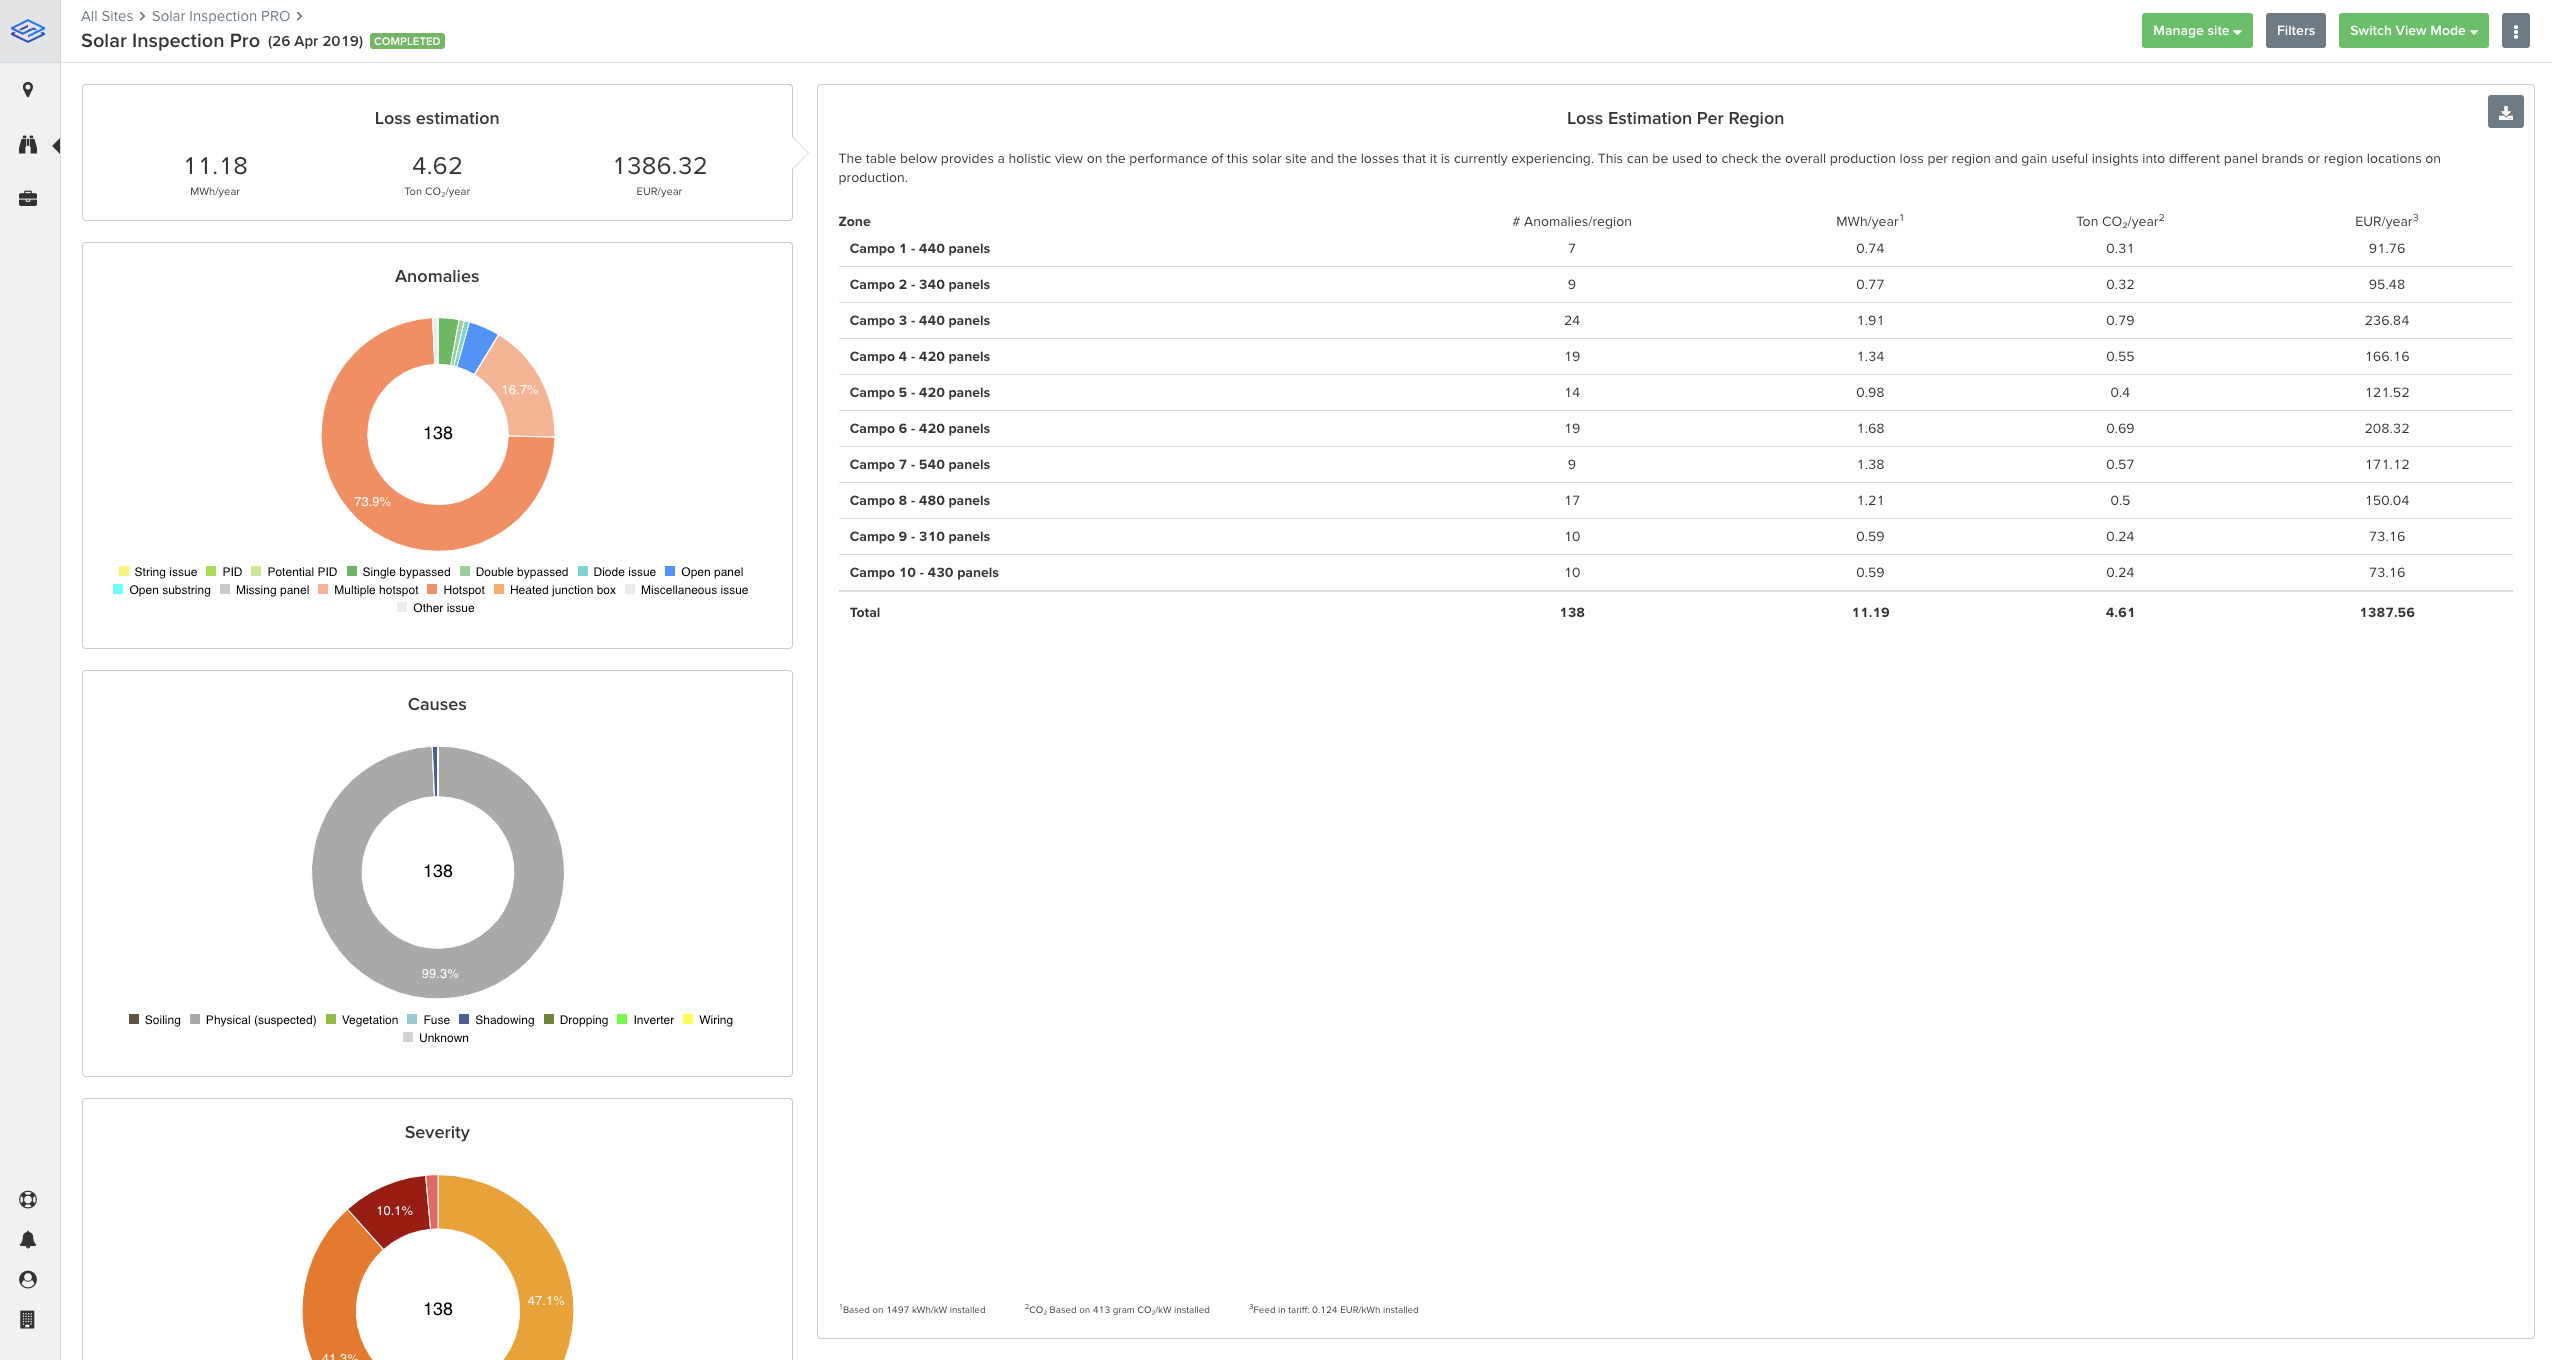
The major benefit of the loss estimation is to understand what regions of your site are underperforming. You can see how many anomalies you have per region. If you are using the same regions as your monitoring system, you can for example cross check the MWh/year losses with your monitoring system.
Anomalies
The anomalies chart shows you how many issues you have for every type of anomaly. This allows you to better understand what the most significant thermal phenomenons are on your site. You can also compare different regions to check if certain issues relate to specific areas of your site.
Want to learn more about the different anomaly types? Click the button below.
Causes
The causes chart shows you the different causes on your site and the number of solar panels affected with those causes. So you have an understanding about what is happening on your site in one eyesight. Once you understand what is causing the thermal problems and where you find them on your site, it's much easier to act on them. Causes will help you to decide if you need to replace your panel or if you just need to cut the vegetation.
Want to learn more about the different anomaly causes? Click the button below.
Severity
The severity chart allows you to have a quick overview of distribution of the anomaly severities. It will help you to understand how significant the problems are on your site and how they relate to the different regions of you site. We defined 3 types of severity which we apply to all thermal anomalies we identify on your site.
Mild - Issues which require no immediate action, but are esssential to monitor over time. For example, a hotspot with a delta T < 5ºC)
Serious - Panels that show issues and should be replaced during the next maintenance. For example, a single bypass substring.
Critical - Panels generating significant loss and should be acted upon as soon as possible. For example, a string issues.
Want to learn more about the different severities? Click the button below.
(Multi) Hotspot Delta
This chart shows you how critical your hotspot/multi hotspot issues are. Hotspots below 5ºC do not represent a significant loss and can be monitored over time. Hotspots of more than 20ºC should be replaced as soon as possible as they represent high energy losses and can in some instances lead to full string failures and are a significant fire hazard.
Want to learn more about hotspots? Click the button below.
Thank you.