

1️⃣ Solar Construction Targets
The platform already supported setting targets for different kinds of elements in a solar construction project. These targets define how many piles, structures and modules are expected to be placed within each region of the site. There was no way for you to set this targets yourself though. You had to contact our support team, send us an Excel file containing the targets and we'd import them.
Now you can just set these targets yourself! 🎉
To do so, go to Statistics mode of one of your Solar Construction operations and click the cog button at the top right of any of the charts using targets. These are the Progress Table Per Region (Site) and Target Completion Per Region (Site) charts.
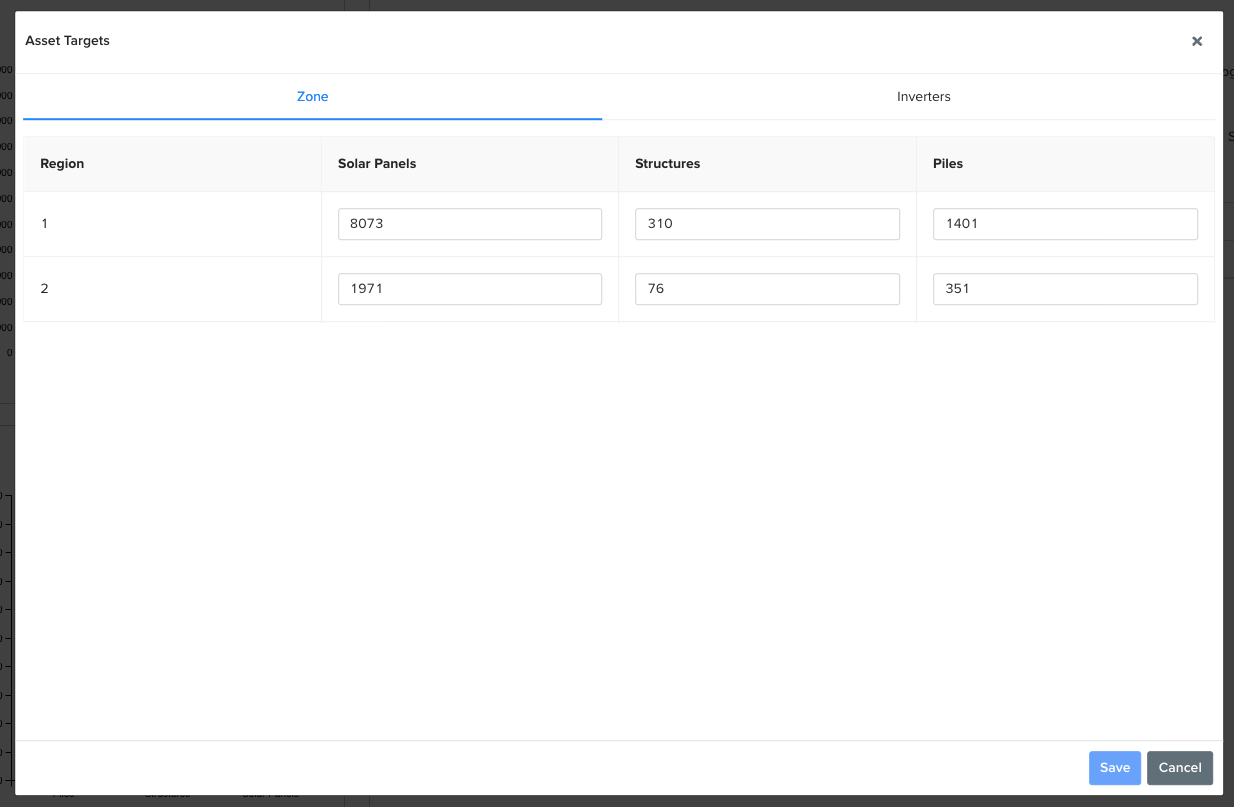
A modal opens to configure the targets. The tabs at the top allow you to select the region type for which you want to alter the targets. The table then contains the targets for the different types of elements for each region. Set the correct target for each of them, then hit Save at the bottom.
💡 You can also set a target of 0 to define you don't expect any elements to be placed in that region. It's handy to detect mistakes in the project.
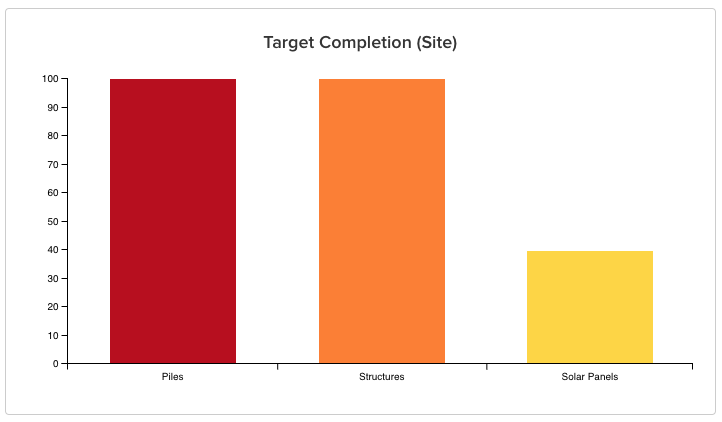
The platform will then be able to calculate completion percentages for your project as a whole, and for each of the regions separately.
2️⃣ Additional Layers in PDF Overlay Editor
The title sure sounds like a mouthful, but it's actually a pretty neat improvement.
The platform allows you to upload your own PDF overlays. Since a PDF doesn't contain any information about where on earth the drawings are located, you have to "georeference" the overlay yourself by placing two points on the map.
Sounds ok, but what if the site hasn't been built yet (or has just been built, but satellite data isn't up to date yet) and you don't have enough information to correctly place your PDF?
We've now added the possibility to enable additional layers in the PDF editor:
DXF layers that contain additional information and can be placed on the map without manual georeferencing.
Other PDF layers that you did manage to place correctly, because they contained more information.
Visual orthomosaics of any operations that already happened on the site to give you a more up-to-date view.
Just open the layer manager using the button at the top right of the map.
