

This guide shows you how to use the regions feature to indicate where specific panel brands and models are used throughout the site. These regions can then be used to analyse the problems that occur on each brand / model.
1️⃣ Define panel type regions
The first step is to draw / import the regions for the different panel brands / models.
You can learn more about the regions feature here.
Create a new region type called Panel Brand & Model to highlight where each brand / model is used.

Draw the regions indicating where each brand / model is used.
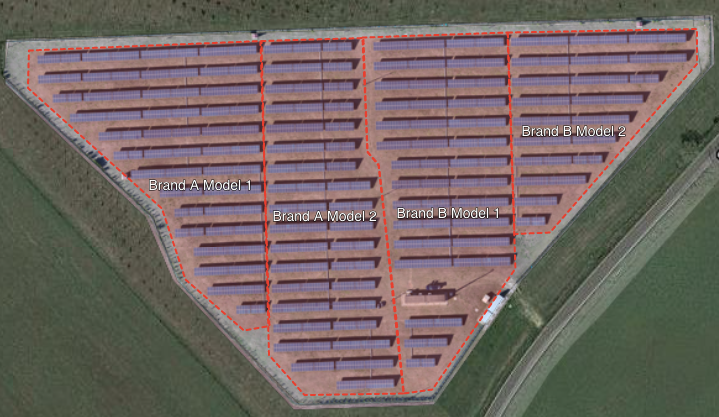
💡 If the same model is used on disjunct regions of the sites, you just have to make sure to give them exactly the same name. Results from these regions will be bundled in Statistics mode.
The region types work hierarchically, meaning that whatever region is on top will be the prominent region across the platform. It will be used for the statistics mode, the default regions when enabling the regions layer as well as on the site overview. This is important for the next step.
2️⃣ Analyse inspection results
Now that you've drawn these regions, you'll notice the following benefits when opening your latest inspection:
Every anomaly now contains a Panel Brand & Model property.
The PDF and CSV exports highlight the panel brand & model of each anomaly.
Statistics mode splits out the statistics per panel brand & model in the detail charts (click on the charts on the left to show them). You'll notice that the statistics in the PDF export also show these charts.
It's the final benefit we'll use here to analyse the results. Go ahead and open up Statistics mode by going to the Switch View Mode button and clicking Statistics Mode.
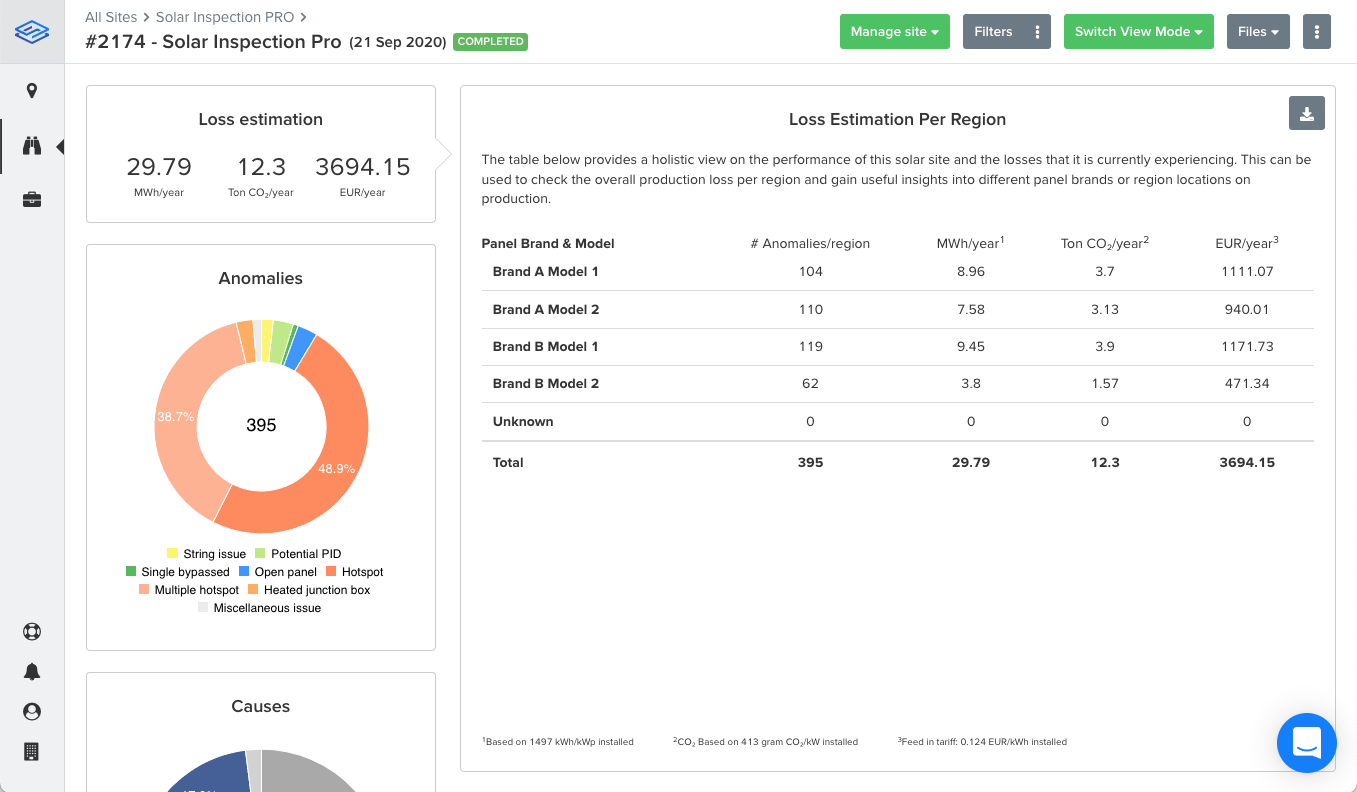
If you've filled in your site properties correctly, you'll immediately notice a loss breakdown table highlighting the loss for each panel brand and model.
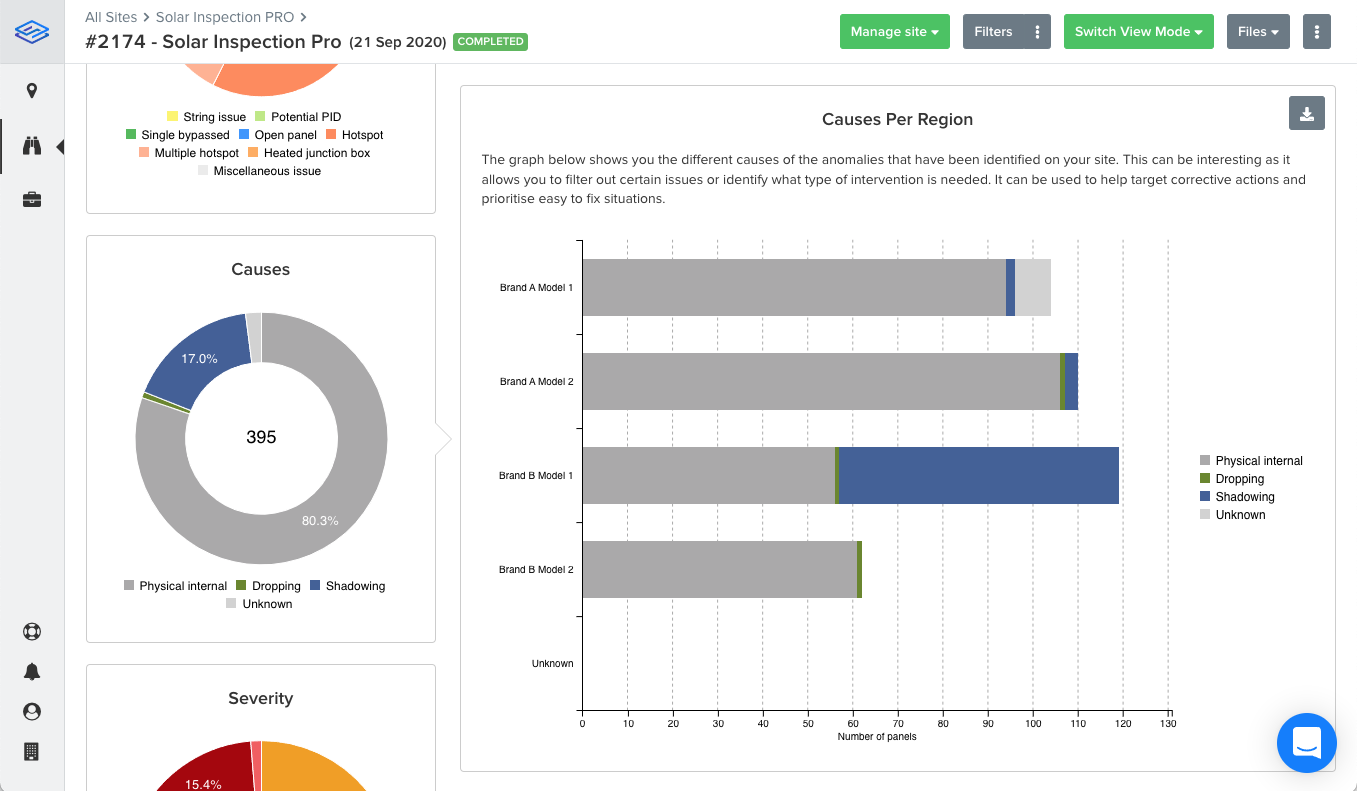
The other charts can refine your analysis. By looking at the causes chart, you can see that one of the models is suffering more from shadowing, which skews the results. Going to Filters on the top and selecting only the Physical internal cause highlights what's going wrong inside the panels.
If you now look at the anomalies chart, you'll notice that Brand A Model 1 is suffering more from Potential PID issues than the other models and Brand A in general seems to have more problems.
⚠️ The anomaly statistics here aren't normalised on the total number of modules in each region. The statistics can be downloaded using the download button on the top right to perform a more detailed analysis.